
Mortgage rates have climbed to their highest levels since last July. The 30-year fixed is sitting at 6.64% as of March 27, up from roughly 6.22% just two weeks prior. The 10-year Treasury yield closed that same Friday at 4.44%, its highest print since summer 2025. Most of what you see will tell you mortgage rates went up because Treasury yields went up. That is true, and it is also incomplete. A second mechanism has been running simultaneously, one that added basis points to mortgage rates beyond what the Treasury move alone would explain, and it has nothing to do with the Fed, or oil, or the Iran conflict directly. It has to do with where the current coupon landed.
The Current Coupon Doesn’t Just Move, It Drifts Across the Stack
To understand why mortgage rates rose more than Treasury yields, you need to understand how MBS are priced. Mortgage-backed securities trade across a range of coupons: 4.5%, 5.0%, 5.5%, 6.0%, 6.5%, and so on. The current coupon is a derived concept: the hypothetical coupon that would price a newly issued MBS at par. It is the pricing anchor for new originations. When mortgage rates rise, the current coupon rises with them, because new loans are being originated at higher rates and pooled into higher-coupon securities.
That movement up the coupon stack is not neutral. Different coupon levels carry structurally different spreads, specifically different combinations of option-adjusted spread (OAS) and option cost. OAS is the spread investors demand over Treasuries after stripping out the value of the prepayment option. Option cost is what investors charge for bearing the prepayment risk itself, the risk that borrowers refinance and hand back principal at the worst possible time for the investor. These two components together determine how much additional yield, above the underlying Treasury, the market requires to hold a given MBS.
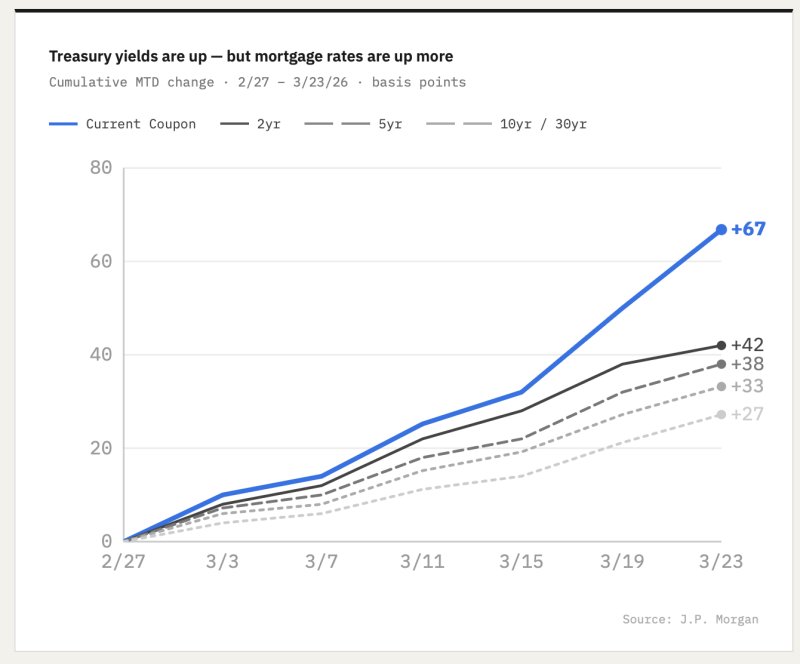
According to J.P. Morgan data, the current coupon sat at 4.81 on February 27. By March 25, it had drifted to 5.40. That 59-basis-point move up the coupon stack pushed originations from a zone where total spread (OAS plus option cost) ran roughly 80 to 85 basis points into a zone running closer to 95 to 105 basis points. The coupon drift alone added approximately 15 to 20 basis points of spread cost, before accounting for a single basis point of Treasury movement. Borrowers are paying for two things at once: the higher Treasury yield, and the higher spread that comes with being priced off a more expensive part of the coupon stack.
The line chart makes this visible in cumulative terms. From February 27 through March 23, the current coupon rose approximately 65 to 70 basis points month-to-date. Every Treasury tenor, the 2-year, 5-year, 10-year, and 30-year, underperformed that move. The 5-year and 10-year were up roughly 40 to 50 basis points over the same window. The gap between the current coupon line and the Treasury lines is the spread widening, expressed as a single picture.

The Spread as a Signal, Not Just a Cost
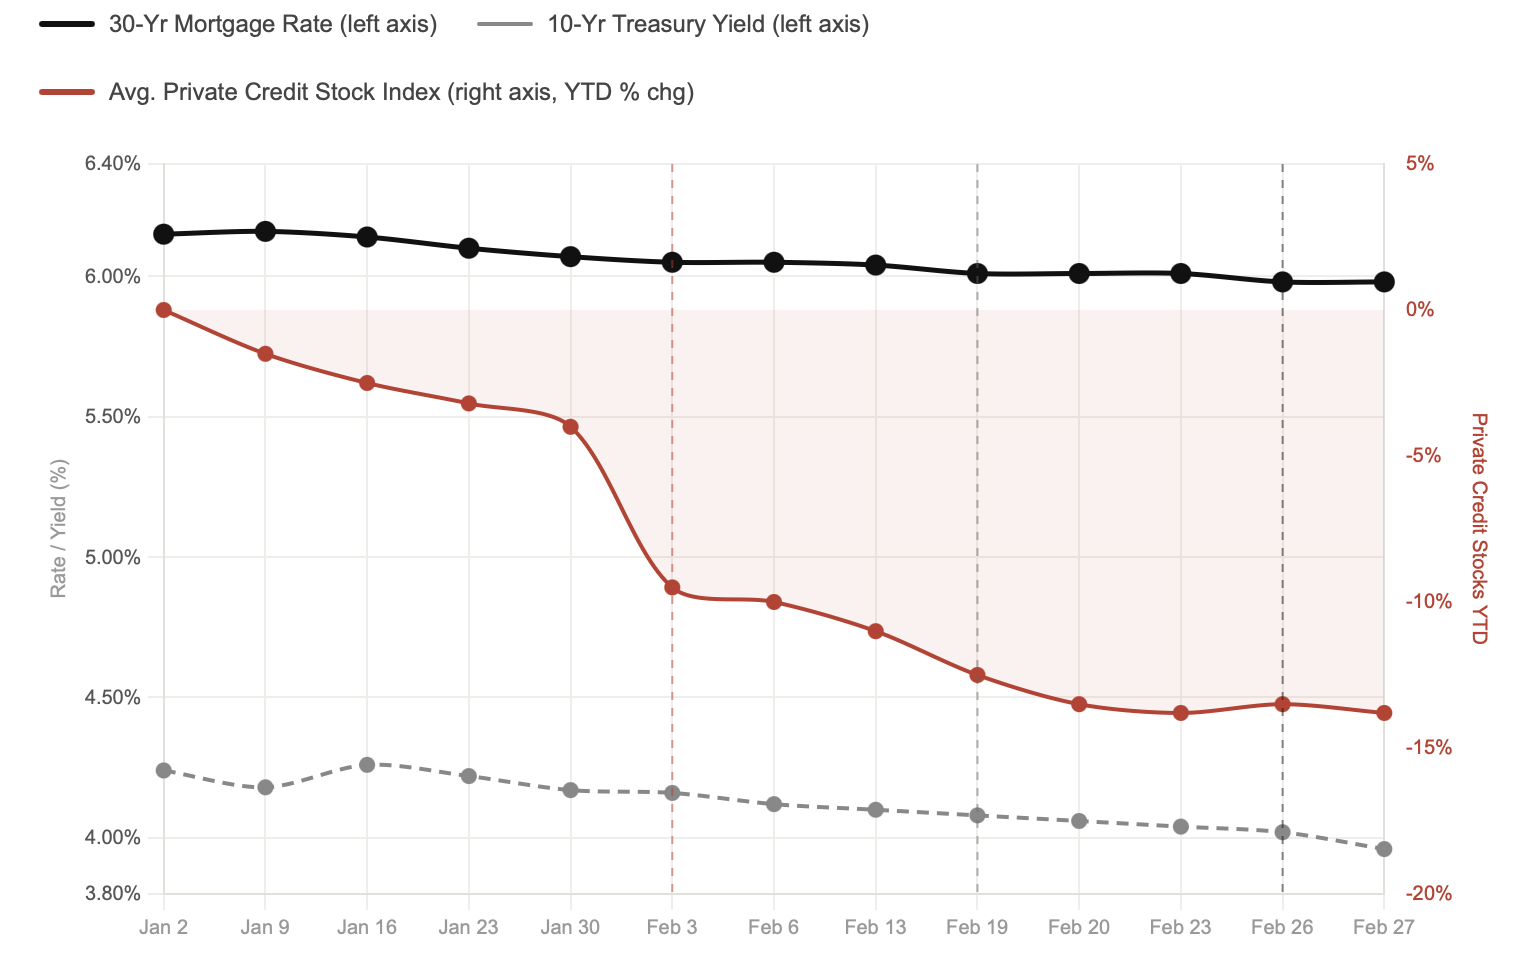
Looking at the broader spread picture reinforces the same story. Bloomberg data shows the conventional current coupon spread to the 5/10 Treasury blend, the standard benchmark for MBS relative value, sitting at approximately 116 basis points as of mid-March, with the Ginnie Mae equivalent at around 111 basis points. Both readings are near the lower end of the range that has prevailed since early 2023, when spreads were running close to 200 basis points at their widest.

That tightening over the past two-plus years tells its own story: spreads compressed as the Fed completed its hiking cycle, as rate volatility declined, and as the GSE retained portfolio expansion announced last year brought a new marginal buyer into the MBS market. The spread environment entering this episode was already lean. There was limited cushion.
What the current chart shows is that spreads, after hitting their tightest levels in recent memory through late 2025 and early 2026, have begun to re-widen. Both the conventional and Ginnie lines have ticked back up from their troughs. This matters because spread widening is additive to yield-driven mortgage rate increases, and in a market where spreads are already near lows and the coupon stack is drifting higher, both forces are now moving in the same direction at the same time.
The Ceiling Argument: When Inflation and Slowdown Price Simultaneously
The Treasury move driving all of this has a specific character worth understanding, because it determines how much further yields, and therefore mortgage rates, can realistically run.
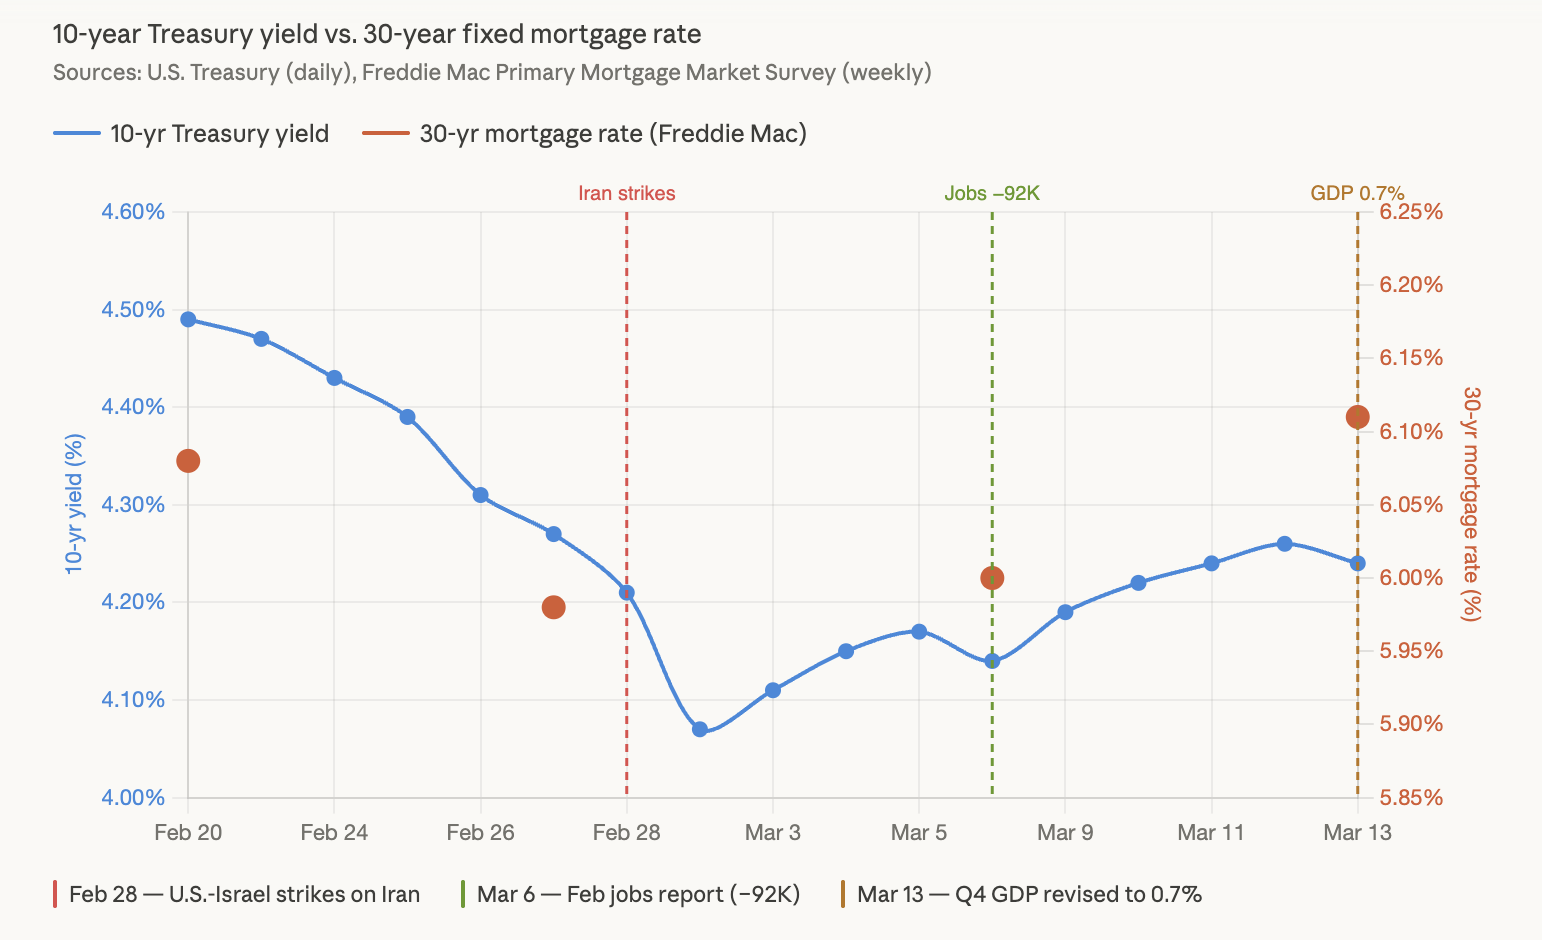
The catalyst was the escalating conflict with Iran and the resulting oil shock. Brent crude topped $112 a barrel in the final week of March; West Texas Intermediate crossed $99. Energy prices feed inflation data with a lag, and the bond market moved immediately to price that through. The 2-year Treasury yield, which is most sensitive to near-term Fed policy expectations, spiked roughly 53 basis points from the start of March alone, pushing through the fed funds rate for the first time since late 2023. As of Friday, March 27, futures markets were pricing a greater than 50% probability of at least one Fed rate hike before year-end, a number that stood at zero as recently as a month ago.
But here is the tension the market is now navigating, and it is the same tension that argues for a natural ceiling on how far yields can run. The February jobs report showed the U.S. economy lost 92,000 positions. GDP data has been revised lower. Consumer sentiment, per the University of Michigan survey, came in at 53.3 at the end of March, a level consistent with recession-adjacent anxiety, not a hot economy. In a normal environment, data that weak would drive a flight to safety into Treasuries, compressing yields and pulling mortgage rates lower. Instead, yields kept climbing, because the inflation signal from oil was loud enough to drown out the growth signal from labor.
That cannot persist indefinitely. The bond market is simultaneously pricing an inflation shock severe enough to warrant rate hikes and a labor market deterioration consistent with a slowdown. These forces pull in opposite directions: hike pricing pushes yields up; slowdown pricing pulls them down. The Iran conflict is the reason inflation is winning the argument right now. But oil shocks, historically, do double duty: they raise near-term inflation and simultaneously suppress medium-term growth. The second effect tends to follow the first with a lag. When it arrives in the data, the growth signal will reassert itself, slowdown pricing will gain the upper hand, and the bond market will have to reconcile the contradiction it is currently holding.
That is the ceiling. It is not a specific yield level. It is a macro regime argument: the same shock that pushed rates higher contains the seed of the force that will eventually arrest the move. For mortgage rates specifically, a 10-year yield structurally constrained by deteriorating growth data, even in the presence of elevated inflation, limits how much further the current coupon can drift up the stack and how much additional spread cost can accumulate.
What This Means If You’re in the Market
For mortgage professionals, the practical read is this: the rate increase borrowers are experiencing right now is larger than the Treasury headline suggests, for structural reasons that are not visible in a rate sheet. The current coupon has moved into a higher-cost zone of the MBS stack, and until it drifts back down, which requires a sustained Treasury rally, not just a pause, that additional spread cost is baked in.
For borrowers trying to time the market, the macro setup is genuinely ambiguous in a way that favors locking over floating for near-term closings. The ceiling argument is real, but so is the near-term uncertainty. A ceasefire with Iran, or a surprise deterioration in jobs or GDP data, could bring rates down quickly. An oil price spike toward $120 or $130, or a Fed communication that validates the hike scenario, could push them higher. The rate you see today reflects both possibilities being priced imperfectly at the same time.
The deeper point is one the headline number obscures: mortgage rates are not simply 10-year Treasury plus a stable spread. The spread itself is a moving target, and right now it is moving in a direction that costs borrowers more than the Treasury chart alone would suggest.
Leave a Reply