
The Strait of Hormuz is open again, at least on paper. Iran’s foreign minister declared all commercial shipping lanes completely open on April 17, and oil markets responded immediately, with WTI crude falling roughly 12% on the session. Treasury yields eased, and mortgage rates, already at their lowest level in a month at 6.30%, have room to drift lower. The geopolitical shock that broke the spring rate rally has reversed, and borrowers have a second chance at the window that briefly opened in February.
Ship tracking data showed that as of Friday afternoon, no oil tankers had actually exited the Persian Gulf, and the U.S. naval blockade on Iranian ports remained in full force. The mortgage market is contending with three problems that a declaration of open shipping lanes does not solve and understanding why requires tracing each one to its source rather than stopping at the surface.
The Asymmetric Channel
Oil prices affect mortgage rates, but not directly and not immediately. The transmission path runs through inflation expectations, then Fed policy optionality, then long-end Treasury yields, and finally into MBS current coupon pricing. Each link in that chain introduces a lag.
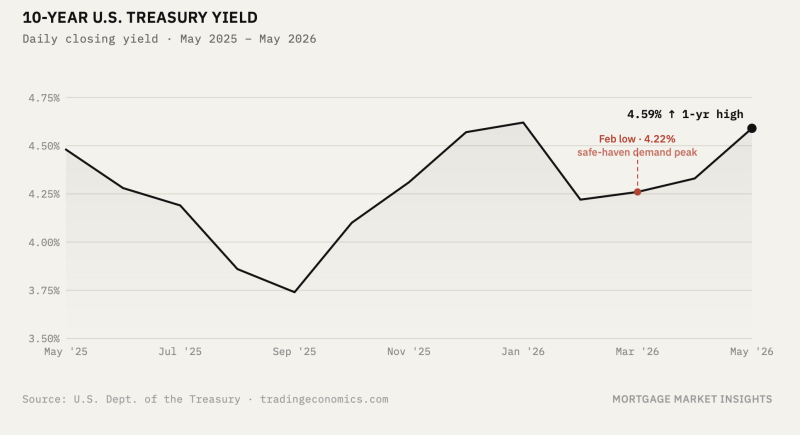
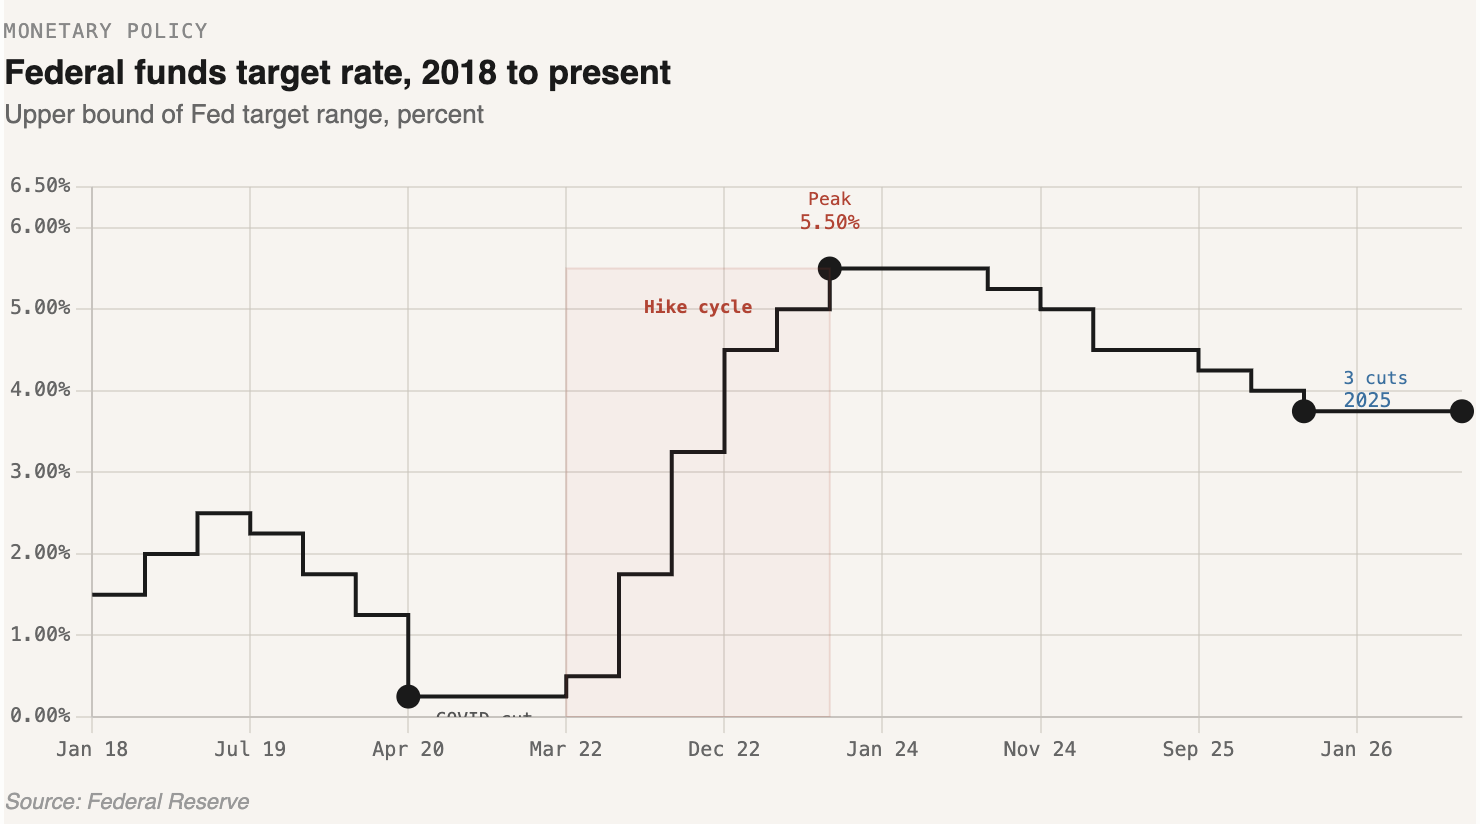
When the conflict began on February 28 and crude spiked above $110 a barrel, bond markets repriced quickly. The 10-year Treasury yield was sitting at 3.96% before the war started. By late March it had climbed to 4.43%, a move of nearly 47 basis points in roughly four weeks, as investors began pricing out any remaining probability of Fed rate cuts and pricing in the possibility of a hike. The Fed’s March FOMC meeting reflected the new reality almost immediately, with the median dot holding at one cut for 2026 and core PCE projections revised higher to 2.7%. Mortgage rates followed, with the 30-year fixed climbing from 6.11% in mid-March to 6.46% by April 2, according to Freddie Mac’s Primary Mortgage Market Survey.

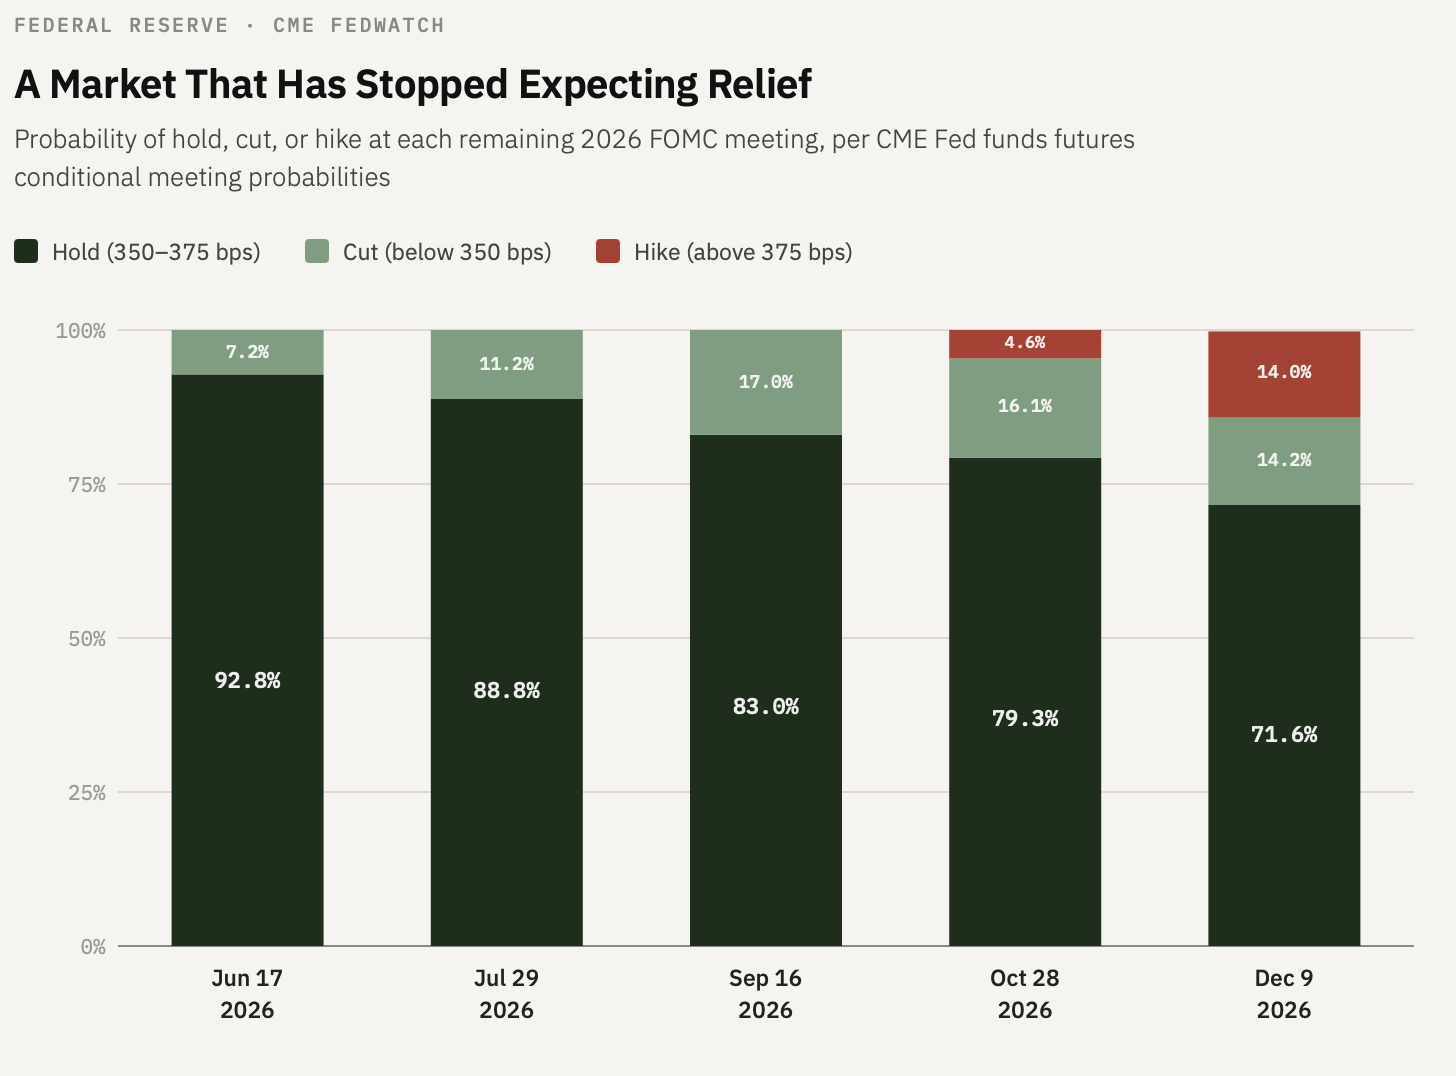
The unwind does not work the same way in reverse. A foreign minister’s post on social media does not change the April inflation print, which reflects energy prices from weeks ago. The Fed will not act on a single session’s move in crude. What the reopening does is restore optionality to the Fed’s calculus. If oil stays down, if headline inflation softens in May and June data, if core services continue to cool, then the Fed has a path to the one cut it penciled in for 2026.
The asymmetry matters for mortgage rates because the inflationary shock gets priced into bonds fast and broadly. The disinflationary relief gets priced in slowly and conditionally. Rates rose from late February through late March in a nearly straight line. They will not fall back over the course of days.
The Balance Sheet Trap
Even if the oil data eventually gives the Fed cover to act, the institution that would act on that signal is in the middle of a transition. Jerome Powell’s term as chair ends in May. Kevin Warsh faces a confirmation process that escalated significantly this week when Justice Department officials arrived unannounced at the Fed’s construction site and were turned away. Senator Thom Tillis has pledged to block Warsh’s nomination from advancing until the investigation is resolved. Powell, whose term as a governor runs to 2028, has said he has no intention of leaving the Board until the matter is closed.
Warsh has been explicit about two things: he wants lower policy rates, and he wants an accelerated reduction of the Fed’s balance sheet. Those two goals are in direct tension when it comes to long-end yields and mortgage rates specifically. The Fed funds rate is a short-end instrument. Mortgage rates are priced off the long end. If Warsh cuts the funds rate while simultaneously accelerating the runoff of the Fed’s MBS and Treasury holdings, he removes a significant source of demand from the long end of the curve precisely as he is easing the short end. The net effect on the 10-year yield, and therefore on mortgage rates, is not obviously positive for borrowers.
The Confidence Gap
The third problem does not show up in rate tables. It shows up in the MBA’s weekly purchase application data.
Purchase applications for the week ending April 3 were 7 percent lower year over year, the first annual decline since January 2025. The week ending April 10 showed a modest improvement in overall applications, driven almost entirely by refinance volume, while the purchase index fell 1 percent on a seasonally adjusted basis. Rates were already improving during that period. The improvement in rates did not move purchase activity.

This is a secondary market structure story as much as it is a housing story. Rate volatility destroys borrower confidence faster than rate improvement can rebuild it. A borrower who watched the 30-year rate climb from 5.98% in late February to 6.46% by early April did not simply reset their decision-making framework the moment rates pulled back to 6.30%. They paused. They waited. They questioned whether locking made sense when the rate they locked last month was already obsolete within weeks.
That behavioral reality has a direct consequence for lenders operating in the secondary market. A frozen purchase pipeline does not simply mean fewer loans to sell. It changes the character of the hedge book in ways that persist even after the macro picture improves.
When purchase volume falls sharply and rates simultaneously improve, lenders face elevated fallout. Borrowers locked at higher rates have the incentive to walk away and relock elsewhere or simply wait. The loans that do not close leave the lender holding hedges against assets that no longer exist. That over-hedged position has to be unwound, and when fallout is elevated across the industry simultaneously, the cost of unwinding is higher than it would be in isolation.
The convexity exposure also shifts. If rates continue improving from here, prepayment speeds will accelerate, particularly in the refinance cohort that is already showing sensitivity to rate moves. MBS duration shortens as prepayment risk rises, effectively putting a ceiling in how much rates can improve from a rally.
And when lenders need to extend their hedge positions because loans are not closing on schedule, they roll their TBA positions forward, buying back the near month and selling the forward month. When the entire industry is buying back the same near month coupons at the same time, driven by the same fallout and pipeline compression, the near month gets bid up. The cost of the roll rises. That elevated roll cost is a hidden tax on lender margins that does not appear anywhere in the rate a borrower sees in the near term, but it shows up in profitability.
What The Current State of Rates Means
The Hormuz declaration is real and it matters. An oil price that stays in the low 80s rather than above 110 changes the inflation trajectory in the second half of this year in ways that are genuinely positive for the rate outlook. The Fed’s path to that one projected cut becomes more plausible, not less.
The mortgage market is responding to six weeks of accumulated volatility and an institutional transition at the Fed. It will take more than an improved rate sheet for purchase demand to meaningfully rebound.
Leave a Reply